Manage Your Cluster from a Phone
This guide describes the web dashboard in a phone browser. For the separate iOS and Android operator application, see Native app. Both use Skulk's canonical APIs, but the native app has its own pairing, encrypted local history, and remote carrier.
The Skulk dashboard is responsive. At phone widths every view adapts to a single-column layout: the header collapses into a menu, side panels become slide-in drawers, and observability takes over the full screen. Nothing is cut down; topology, the model store, chat, placement, and live runner internals all work from a phone browser.
Opening the dashboard
Every Skulk node with the built dashboard assets serves the dashboard (a headless node without them serves only the API). From a phone on the same network as a dashboard-serving node:
http://<node-address>:52415
It does not need to be the master. The dashboard talks to the whole cluster through whichever node serves it.
From outside the local network
If your nodes are on a Tailscale tailnet, the dashboard is reachable from anywhere your phone has connectivity. Install the Tailscale app on the phone, sign in to the same tailnet, and open the node's Tailscale address (or MagicDNS name):
http://<node-name>.<tailnet>.ts.net:52415
This is one private-network browser access option: the phone joins the same overlay as the nodes. The native app instead uses paired encrypted relay access and does not require a VPN app. See Remote access for the connection and authorization boundaries. The observability Node tab shows each node's own Tailscale state, which helps confirm the overlay is up when you are away from the cluster.
Add it to your home screen
Both iOS Safari (Share, then "Add to Home Screen") and Android Chrome (menu, then "Add to Home screen") will pin the dashboard as an icon that opens full-screen, which makes it feel like an app rather than a browser tab.
The mobile layout
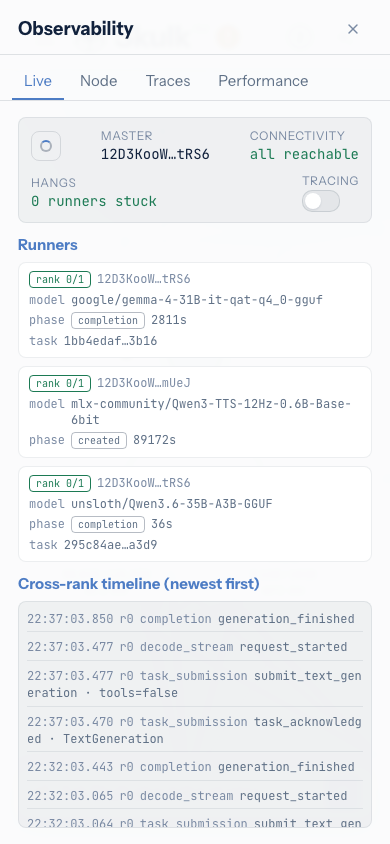
These captures show the actual dashboard connected to a live cluster at phone dimensions. Model availability and resource readings reflect the capture time.
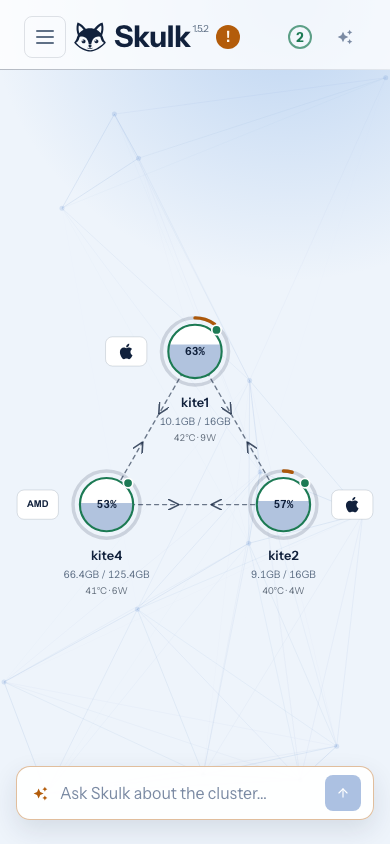
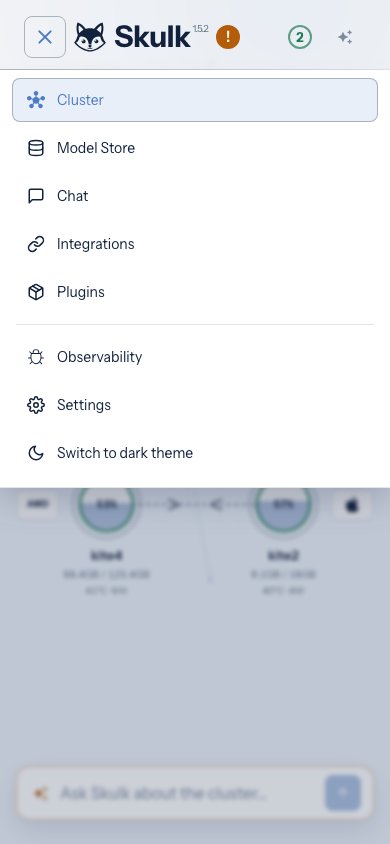
The hamburger button opens a menu carrying everything the desktop header shows inline: Cluster, Model Store, Chat, Integrations, and Plugins, plus Observability, Settings, and the theme toggle. The cluster view renders the same live topology as desktop, with node cards sized for the smaller canvas.
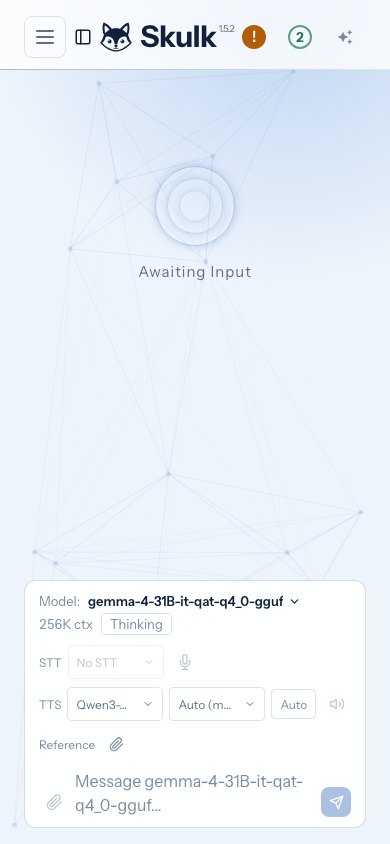
Chat works against any placed model, streaming tokens with the same time-to-first-token and throughput stats as desktop. The conversation history and active-instances panels open as drawers over the content and close by tapping the dimmed area behind them.
Observability opens as a full-screen sheet with the same tabs as desktop: Live (runner phases and the cross-rank timeline), Node (per-node hardware, memory, and connectivity details, including Tailscale state), Traces (saved generation traces), and Performance (observed request performance envelopes). Watching a placement load layer by layer from a phone is a good way to keep an eye on a long model load without sitting at a desk.
Notes
- The dashboard is served by nodes that have the built web assets. A headless node without them still serves the API; point the phone at a node that has the dashboard built.
- All dashboard traffic stays inside your network (or tailnet). Nothing about the mobile layout changes what is exposed.